Airtable continues to be a dominant force in modern project management and data organization, celebrated for its flexibility and intuitive interface. At the heart of its adaptability are its diverse views, which transform raw data into actionable insights. But what exactly makes these views so powerful, and how can you leverage them in 2026? Essentially, views in Airtable are not separate databases but unique visual filters and presentations of the same underlying data. You can create multiple perspectives for a single base, each configured with specific fields, filters, sorting rules, and layouts to meet different analytical or collaborative needs.
Creating a view is a straightforward process. Navigate to the 'View' sidebar, hover over the view types for brief descriptions, and select your desired format. Once created, you can deeply customize it. The configuration panel allows you to:
-
Select Visible Fields: Choose which columns or data points to display.
-
Apply Filters: Show only records that meet specific conditions (e.g., 'Status is Complete').
-
Set Sort Order: Organize records alphabetically, by date, or numerically.
Let's explore the six view types available in the free version of Airtable, which remain core to its functionality in 2026.
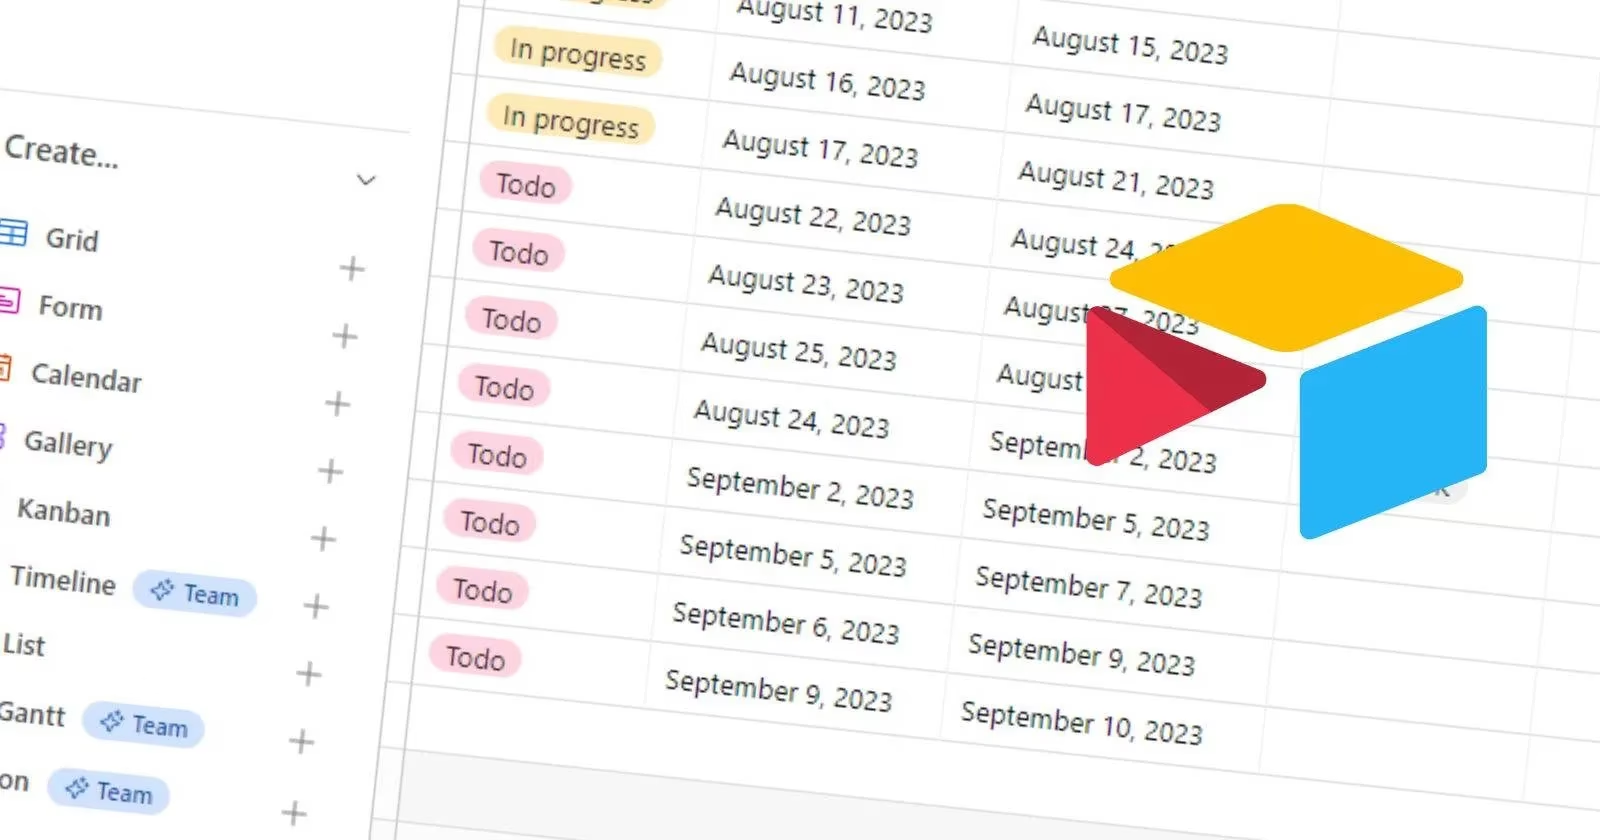
📊 1. Grid View: The Classic Spreadsheet
As the default view, the Grid view presents data in a familiar row-and-column spreadsheet format. It's the workhorse for data entry and bulk editing.
-
Best For: Data migration from tools like Excel, making bulk updates, and viewing comprehensive datasets in a simple table.
-
Key Feature: Easy drag-and-drop for rearranging columns and rows.
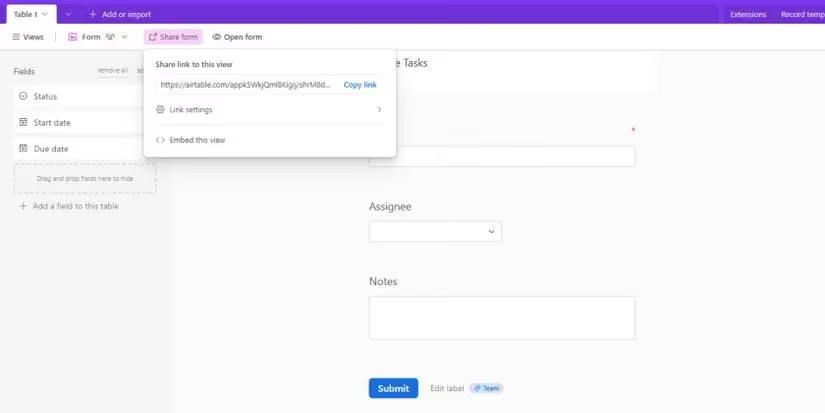
📝 2. Form View: Streamlined Data Collection
Form view generates a customizable web form for adding new records to your base. It's a secure way to gather information without granting full database access.
-
Best For: Collecting data from clients, survey responses, or team submissions.
-
Key Feature: You can share the form link widely; submissions automatically create records. Customize mandatory fields, dropdowns, and instructions.
📅 3. Calendar View: Visualizing Time
This view plots records onto a calendar, requiring at least one date field in your base. It provides a clear timeline of events, deadlines, or schedules.
-
Best For: Managing project deadlines, editorial calendars, event planning, and tracking milestones.
-
Key Feature: Drag and drop records between dates to update deadlines instantly—a perfect blend of visualization and interaction.
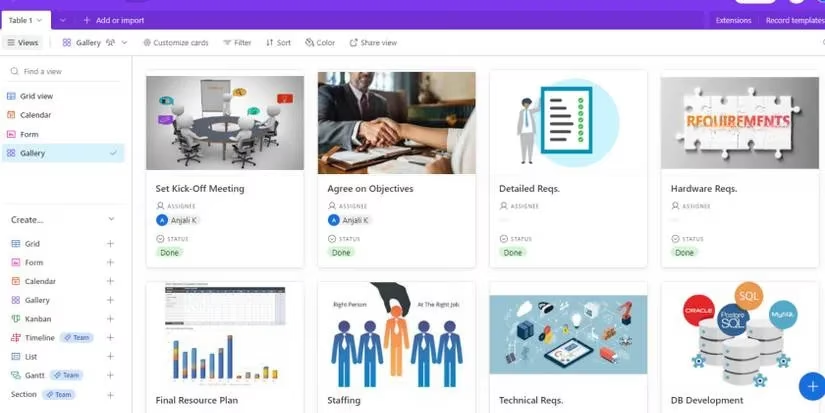
🖼️ 4. Gallery View: Visual & Media-Centric
Gallery view displays each record as an attractive card, ideal for visual databases. A primary image can be set using an 'Attachment' type field.
-
Best For: Product catalogs, design portfolios, employee directories, or any database where visual context is key.
-
Key Feature: Direct image drag-and-drop from your computer or the web onto cards. Customize card layout to show specific fields alongside the image.
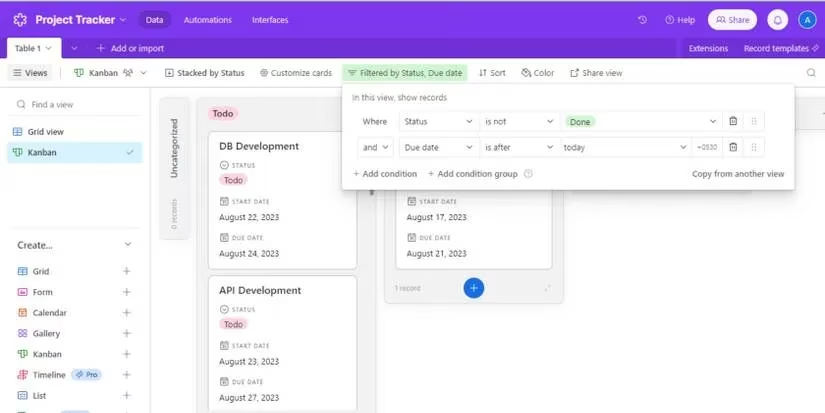
🗂️ 5. Kanban View: Agile Project Management
Inspired by Kanban boards, this view groups records into columns based on a single-select field (like 'Status' or 'Assignee'). Each record becomes a movable card.
-
Best For: Tracking project workflows, sprint tasks, sales pipelines, and any process with distinct stages.
-
Key Feature: Visual workflow management. Drag cards between columns (e.g., from 'In Progress' to 'Done') to update their status intuitively.
📋 6. List View: Clean and Linear
List view presents records in a simple, vertical list, often with indentation for hierarchical data. It's optimized for readability and simplicity.
-
Best For: Viewing data on mobile devices, creating checklists, or displaying nested information like task subtasks.
-
Key Feature: Condensed visualization with optional prefixes; excellent for focusing on one record at a time without spreadsheet clutter.
Why Do Airtable Views Matter in 2026?
In today's data-driven environment, the ability to quickly reconfigure how information is seen is invaluable. Airtable views empower teams to:
-
Enhance Collaboration: Different team members (e.g., managers, designers, and clients) can have views tailored to their needs.
-
Improve Decision-Making: Visualizing data in a calendar or Kanban board can reveal bottlenecks and timelines more effectively than a raw spreadsheet.
-
Maintain Data Integrity: Using Form views for input ensures data is collected consistently and correctly.
Is Airtable the only tool offering such versatility? While it remains a leader in smart database management, the landscape in 2026 is competitive. However, Airtable's unique combination of database power, user-friendly views, and extensive customization continues to make it a top choice for organizations seeking to visualize and manage their projects and data dynamically. The true power lies not just in storing data, but in viewing it through the right lens for every situation.
Comments